Introduction
At a recent conference, Milt Olsen, CEO, Chief Engineer, and CAT IV Vibration Analyst, was talking shop with a few of his vibration industry peers. As they discussed their analysis equipment, Milt couldn’t help but note with some surprise that the other “top dogs” in the industry were still playing in the same ballgame he’d been playing in, and found lacking, some 20 years previously.
The same ballgame, in fact, that he had struck out of that fateful day when a conveyor system had sent a golf-ball sized rock crashing into his data collector (to read more of Milt’s story, click here and scroll down to “How We Got Started”) and inspired him to create a better solution for vibration data collectors.
If you, like some of those at the conference, find yourselves playing in an outdated game with subpar equipment, let us introduce you to the VBox3 vibration data collector and how it broadens the parameters and scope of what is even possible to do with a vibration data collector.
What is the VBox3 Vibration Data Collector?
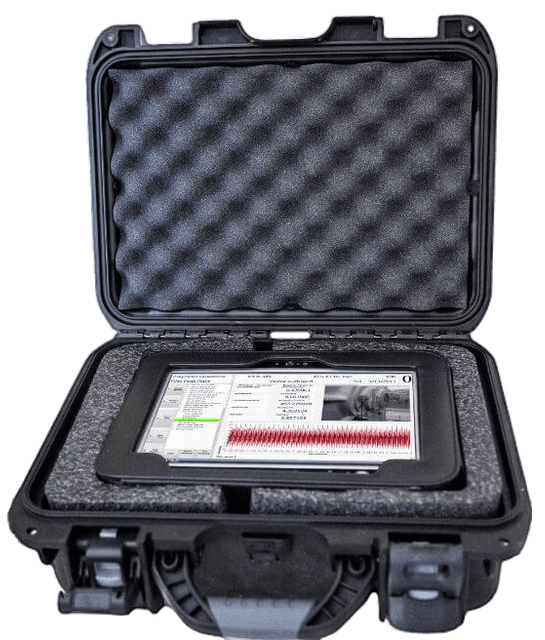
The VBox3 is a portable 3-channel vibration data collector that was designed from the ground up to use a triaxial vibration sensor.
The VBox3 is designed and built by engineers who regularly go into the field, collect vibration data, and understand what is required and desired in a condition-based monitoring solution. As such, the VBox3 is designed to reduce the number of required data readings while the intuitive interface provides extreme ease of use in database setup, data collection, analysis and reporting.
The VBox3 runs on a rugged, Windows-based Toughpad tablet with a powerful Intel core i5vPro processor, 8 GB of memory and 256 GB solid state hard drive for rapid data collection and robust storage. It features a full HD daylight visible multi-touch display. Durability characteristics include 4-foot drop resistance, all-weather dust and water-resistant design, and 14 hours of continuous battery operation.
How is the VBox3 Different from Competitors?
Our approach is different from our competitors in a few ways. First, the VBox3 uses an easy-to-use Windows 10-based tablet with a 10” screen—which is larger and more intuitive to use than other competing devices. But the biggest difference shows up when you start comparing the data that is collected.
Other competing devices rely on calculating the FFT spectrum by collecting a series of data sets that are then averaged together to create a single smaller dataset that is stored. For example, let’s say they take a 5 second data set—but out of those 5 seconds, only the average is saved. By saving only the average, they’ve minimized the amount of storage required. At first glance, may seem like a smart thing to do. However, the result is usually around 6,400 lines of resolution for their spectrum and then a subset of the time waveform.
The VBox3, on the other hand, can take the same 5 second data set, but end up with a continuous set of data that is 5 seconds long. The end result is a 42,500 line spectrum at .2 Hz (12 Rpm) resolution. Since data processing is low cost and data storage is cheap, it “just makes sense” to use the complete time waveform, and the return in the end is well worth the effort. More lines of resolution means better analysis, more details, and better insights on the health of the machine.
Plus, if a client wants an average spectrum rather than a single average high resolution one for any reason, it’s easily calculated from the larger data set.
Benefits of the VBox3 Vibration Data Collector
We could sit here at length and discuss the benefits of using the VBox3, but really, the most important benefits can be summed up nicely in these five bullets:
- You get a detailed, high-resolution analysis.
- You can do analysis in your office as if you are at the machine because you have the whole data set. Run into another question after you’ve finished collecting data? No problem. You have the entire data set at your disposal, so you don’t have to go back out to run another analysis.
- You can easily digitally filter the data through a low pass, high pass, or band pass filter.
- Digital de-modulation: all our competitors do demodulation, but they have to take an additional data set that is correctly configured for the specific machine, and, because it’s so painful to do, most people don’t want to. We, on the other hand, can do it on the fly because we have the big data set.
- As mentioned previously, the VBox3 runs on a Windows 10-based tablet, which gives it virtually unlimited storage compared to other competitors. A simple way of thinking about it from a horsepower perspective (not an exact comparison, obviously, but an easy way to showcase the difference) is that other competitors are driving an itty-bitty smart car and trying to cram as much in as they can. The VBox3, on the other hand, is driving an Intel i5 processor that’s more like a semi-truck with the large capacity and large processing power that go along with it. So, while they’re trying to cram all their data into their smart car, we’ve got a diesel pulling a 53’ trailer but without adding any weight or unwieldy drawbacks—in fact, the VBox3 is a battery powered portable unit (4.5lbs) that is simple and flexible to use.
Conclusion
If you are interested in case studies or more information, visit the VBox3 product page, or reach out to our wonderful sales team. We’d love to hear from you.
Our engineers have spent years in the field performing vibrations-based machine condition monitoring. We started this blog so that you can tap into their knowledge and get answers regarding vibration sensors, our products and services, how we compare to similar products on the market, maintenance tips, and more…but we’re just getting started. If you have any specific questions you’d like addressed as we build up this resource, we’d love to hear about it! Contact us here or send us a message on LinkedIn.